
INTEGRATED ANNUAL REPORT 2023
For the year ended 30 September 2023
For the year ended 30 September 2023
KEY RESOURCES
| HC | Experienced, diverse leadership team and skilled employees, underpinned by strong governance structures | ||
| NC | Reliable and sustainable access to primary agricultural products (including wheat, rice, maize, oats, sugar and sorghum), other ingredients, packaging, energy, fuel and water | ||
| MC | Well-capitalised manufacturing plants, supported by efficient and effective supply chain, distribution and logistics networks | ||
| SRC | Strong and trusted corporate brand, positive supplier and customer relations, and constructive relationship with government, regulators and host communities | ||
| IC | Continuous investment in our brands through research and development, marketing investment, and innovation informed by strong consumer insights | ||
| FC | Access to financial capital, through strong cash generation and enhanced by superior investor returns and sustained market confidence | ||
| Read more here. | |||
KEY RELATIONSHIPS |
|||
|
|||
| Read more here. | |||
OUR OPERATING ENVIRONMENT |
|||
| Trends impacting value: | |||
|
|||
| Read more here. | |||
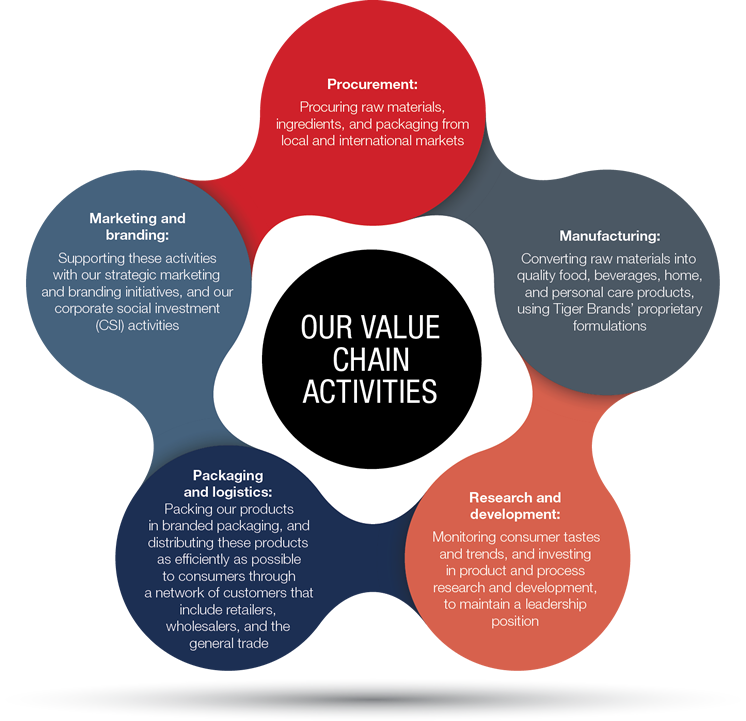
Tiger Brands creates value and delivers on its purpose by producing, marketing, and distributing everyday branded food, home and personal care products, predominantly in South Africa, with a growing market presence across Africa. Our core category is food with immediate adjacencies in beverages and snacks and treats. Our product portfolio is well-placed to grow presence in most occasions with further innovation or inorganic opportunities possible.
MATERIAL RISKS
1.1 Market responsiveness
1.2 Cost competitiveness
2.1 People security
2.2 People safety
2.3 Food safety
2.4 Cyber security
2.5 Consumer preferences
2.6 Third-party supplier risks
2.7 Industrial action
2.8 Insufficient electricity supply
2.9 Security of food supply
Climate change: a particular risk type Read more here.
GROWTH OPPORTUNITIES
OUR REVENUE STREAMS
Our revenue streams comprise product sales from:
Material revenue differentiators
OUR COST STREAMS
Our most significant cost streams are:
Material cost differentiators
SENSITIVITY ANALYSIS
Tiger Brands’ cost base is highly sensitive to exchange rate volatility, with ~70% of our costs directly or indirectly exposed to exchange rates.
| Variable | Impact* | |
|---|---|---|
| Forex (sensitivity to 5% weaker rand) | ||
| Domestic operations** | (R586 million) | |
| International and associates translation | R66 million | |
| Exports | R30 million | |
| Price increases | ||
| Effect of a 1% movement in price increases | ||
| Up | R402 million | |
| Down | (R402 million) | |
| Volume growth | ||
| Effect of a 1% movement in volume growth | ||
| Up | R112 million | |
| Down | (R112 million) | |
| Logistics | ||
| R1 increase per litre of fuel | (R38 million) |
| * | Impact on operating income |
| ** | Assumes no recovery in price |
VALUE OUT
| Our products (outputs) | |||
 |
|||
| Read more here | |||
| OUR OUTCOMES | |||
| Significant impacts (positive and negative) include: | |||
|
|||